Wideband tympanometry is an advanced hearing test that evaluates middle ear function by measuring acoustic reflectance or absorbance across a broad range of frequencies, unlike traditional single-frequency tympanometry.
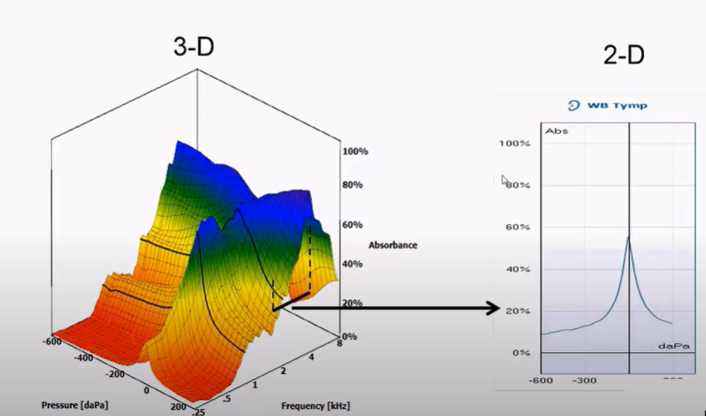 | A WBT is typically displayed as a 3D graph, showing the tympanometric results at all measured frequencies. Audiqueen only shows 2D results. |
Audiqueen can import wideband tympanograms (WBT) from Interacoustics Titan Suite and GSI Tympstar Pro.
Each WBT result contains a large amount of data, much of which is imported into Audiqueen. However, due to technical limitations, the suites cannot import all data into Audiqueen. It is therefore best to also store the complete dataset in the original suite. Another option is not to transfer the original data to Audiqueen, but to create a report in the suite and have that report automatically imported by Audiqueen (see support pages).
Audiqueen displays (if available):
- The regular tympanograms at 226 Hz, 678 Hz, 800 Hz, and 1000 Hz, and also at the resonance frequency;
- The Wideband Average;
- The Wideband Absorbance
.
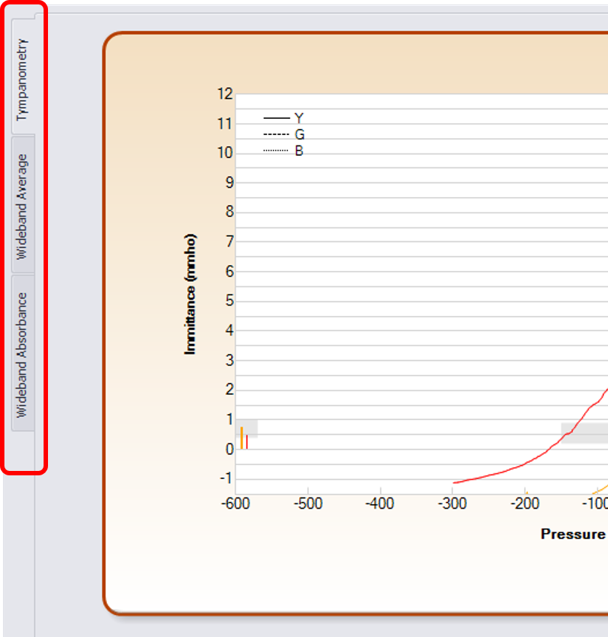
The various components of WBT can be found under
the different tabs on the impedance graph.
Regular tympanograms at 226 Hz, 678 Hz, 800 Hz, and 1000 Hz, and at resonance frequency
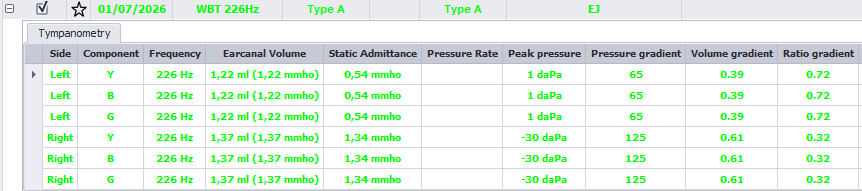
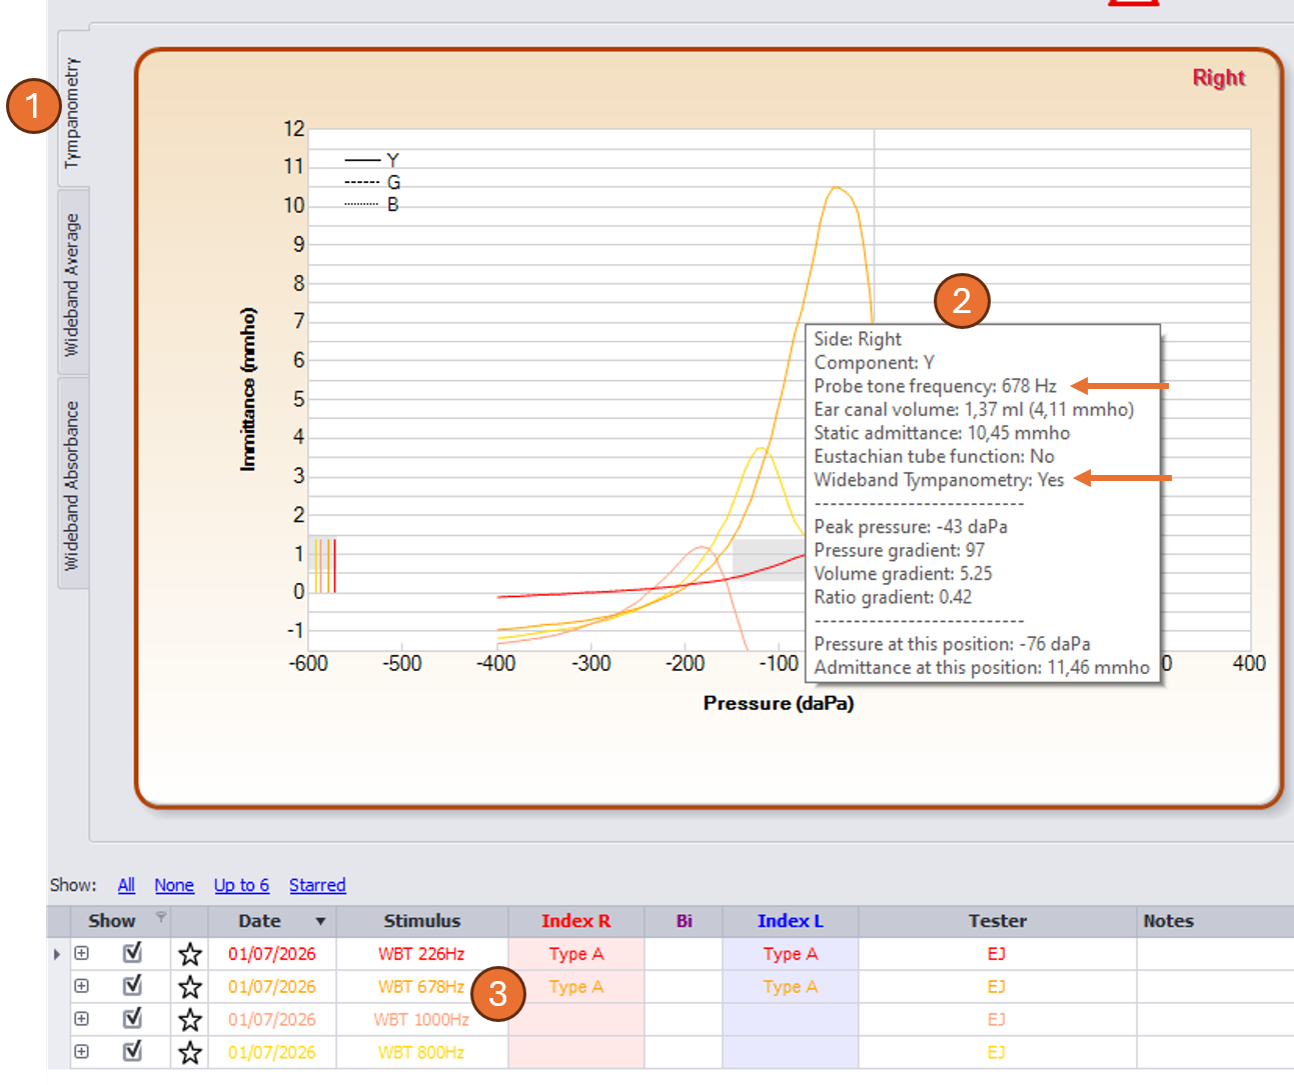 | Audiqueen displays only the tympanograms at the frequencies 226, 678, 800, and 1000 Hz. (1) Click on the Tympanometry tab to view the tympanograms; (2) Hover the mouse over a tympanogram to see that it was extracted from the WBT data and which frequency it concerns. (3) You will find these and more details in the grid.
|
Wideband Average
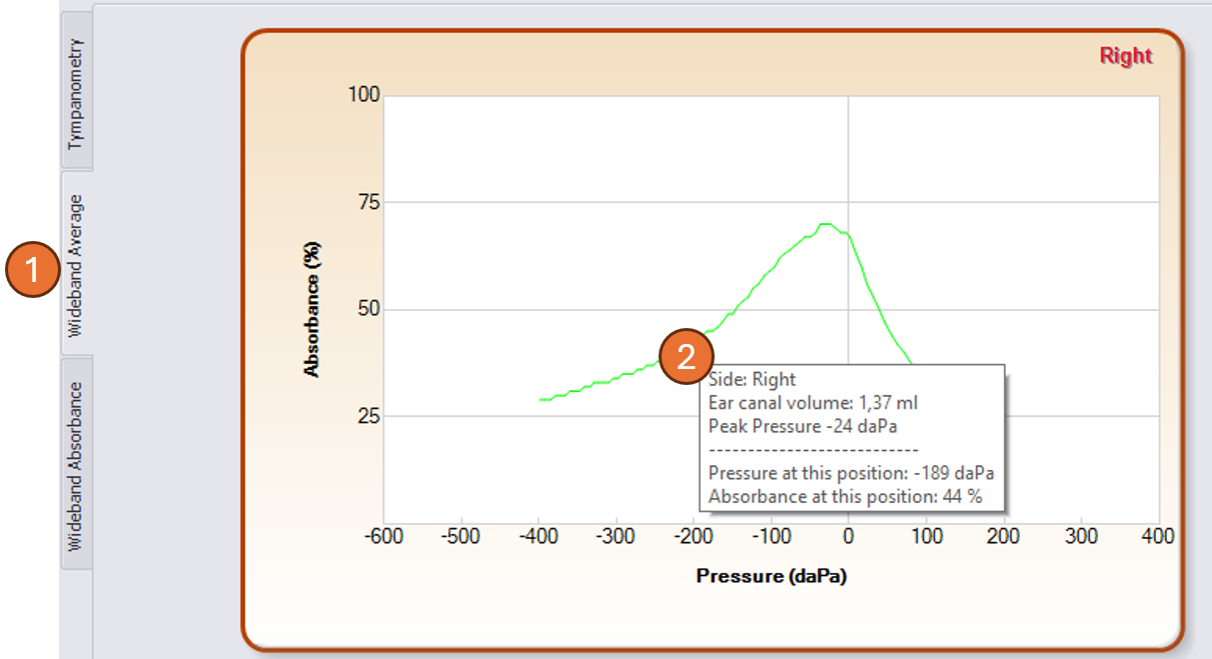 | Audiqueen displays the Wideband Average as received from the tympanometer. This is a 2D graph representing the average tympanogram across multiple frequencies. Note the dimension of the vertical axis (%). (1) Click on the Wideband Average tab to view the result; (2) Hover the mouse over a tympanogram to retrieve more details. |
Wideband Absorbance
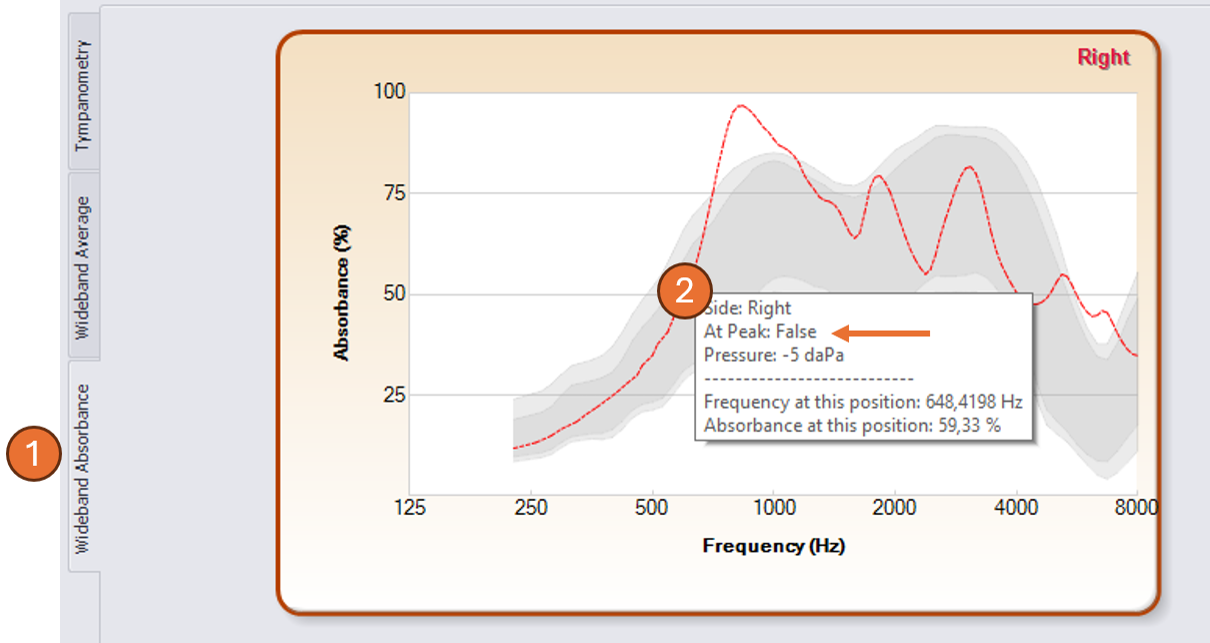 | Audiqueen displays the Wideband Absorbance, both at ambient (dashed line) and peak (full line) pressure, as received from the tympanometer. This is a 2D graph representing the absorbance (%) across multiple frequencies. (1) Click on the Wideband Absorbance tab to view the result; (2) Hover the mouse over a curve to retrieve more details. Note that the line At Peak is 'false' for ambient pressure, and 'true' for peak pressure. |
More details can be found in the expanded table or in the form that appears when hovering over the tympanogram (see support pages).
Normal Zones of WB Absorbance
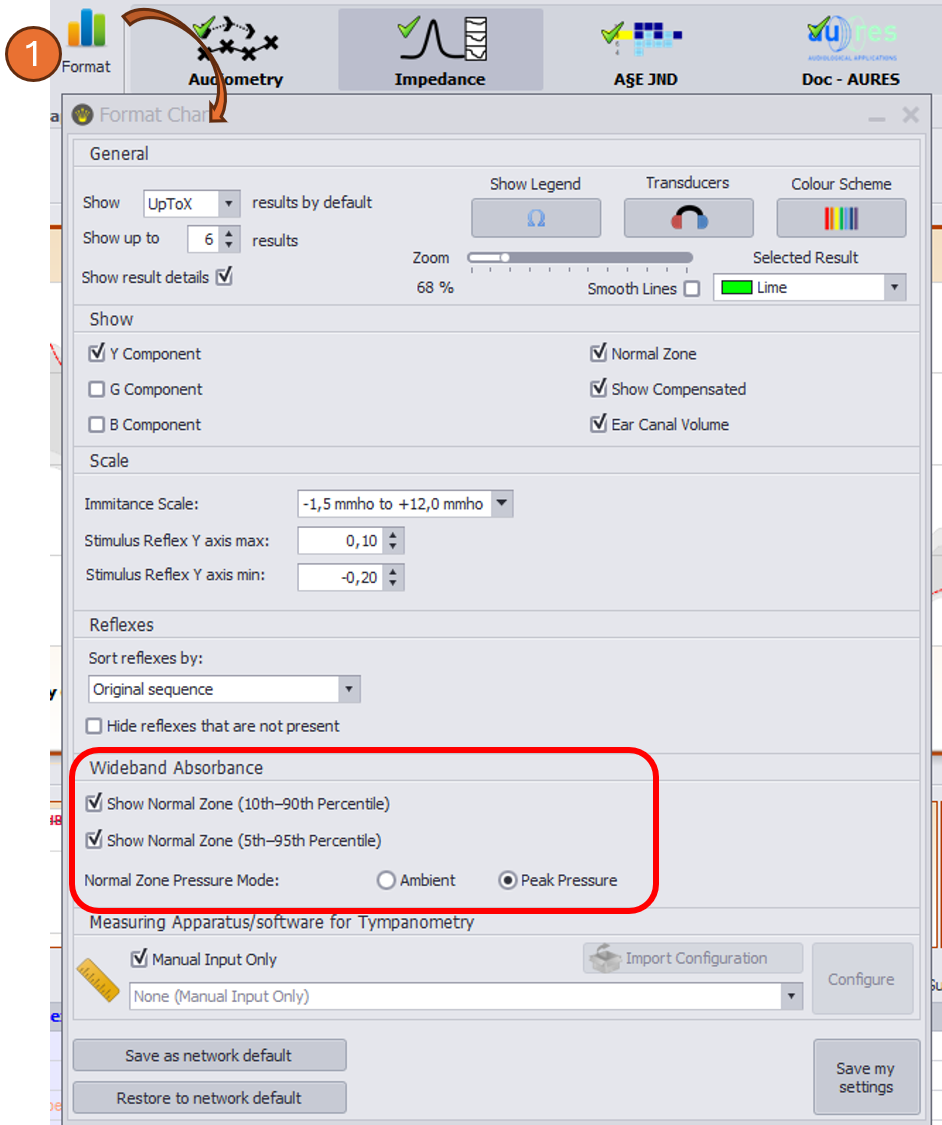 | You can configure whether you wish to see normal zones on the Wideband Absorbance graphs. (1) To do this, click on Format in the Impedance Test Type to find the options: 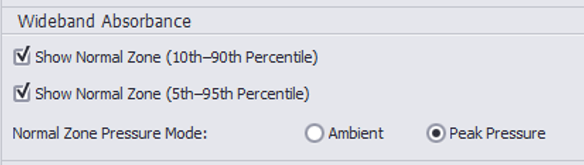 Audiqueen can display the age-related normal zones at ambient or peak pressure. References: Sanford CA, et al. Sound-conduction effects on distortion-product otoacoustic emission screening outcomes in newborn infants: test performance of wideband acoustic transfer functions and 1-kHz tympanometry. Ear Hear. 2009;30(6):635-52. doi: 10.1097/AUD.0b013e3181b61cdc. Liu YW, et al. Wideband absorbance tympanometry using pressure sweeps: system development and results on adults with normal hearing. J Acoust Soc Am. 2008;124(6):3708-19. doi: 10.1121/1.3001712. |
Was this article helpful?
That’s Great!
Thank you for your feedback
Sorry! We couldn't be helpful
Thank you for your feedback
Feedback sent
We appreciate your effort and will try to fix the article